
How AI could change 100 jobs
I went through 100 occupational groups and asked what each of the three stages of AI adds to the work. A few patterns keep coming back.
Edited · 11 min read
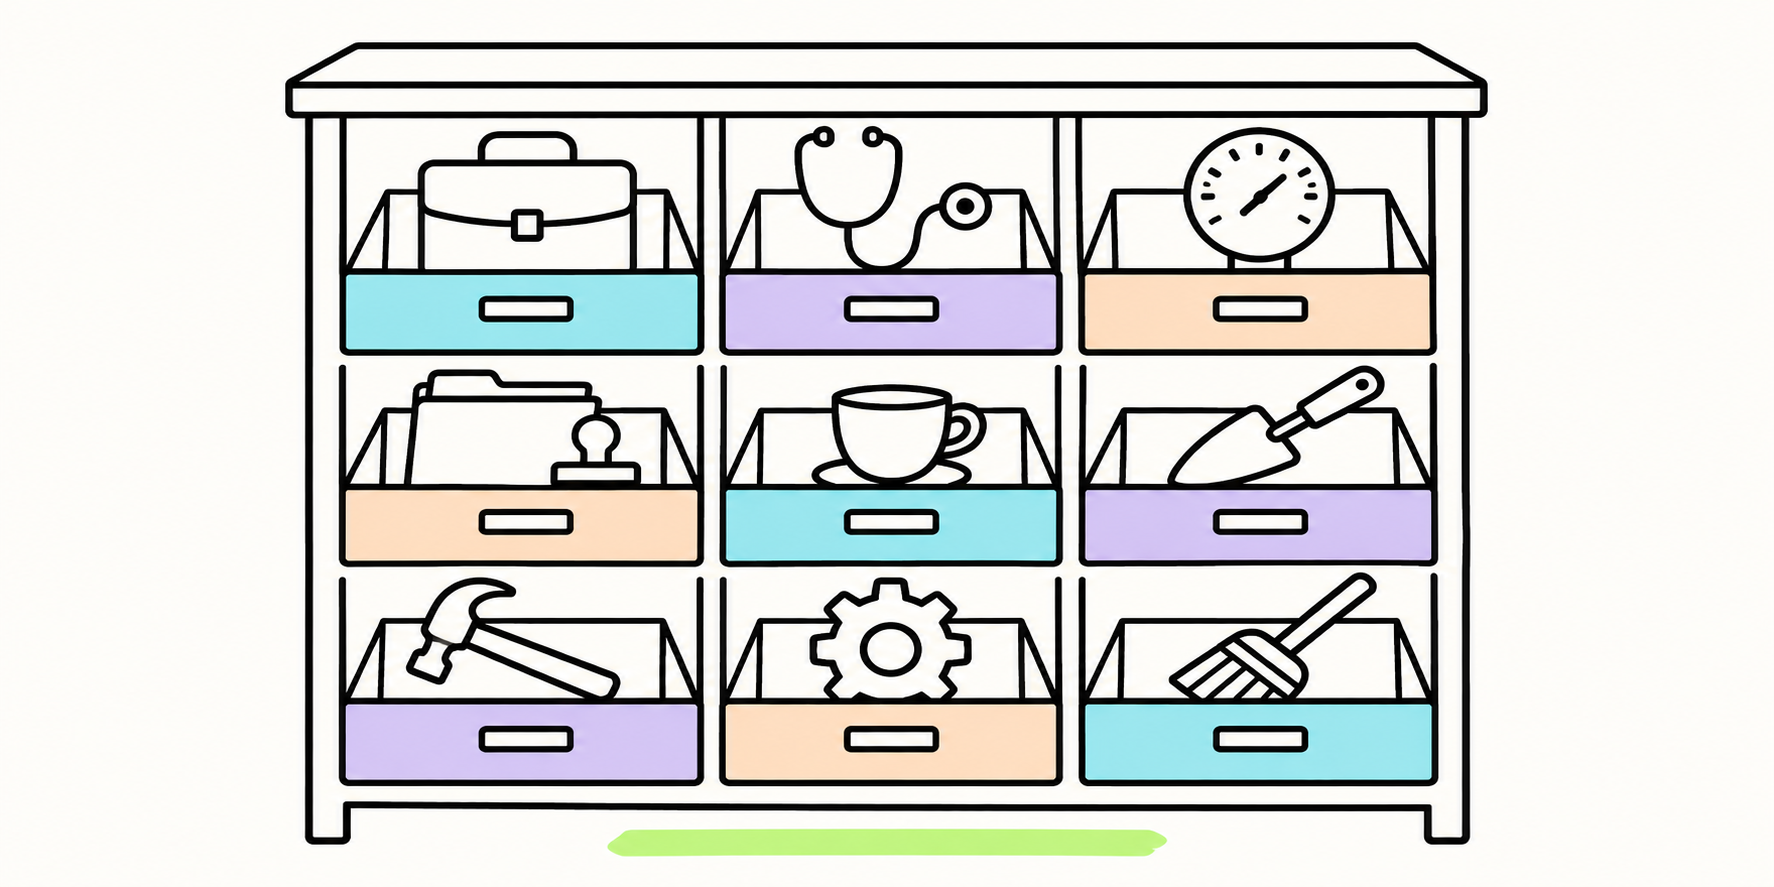
Which jobs, and how
This post asks how artificial intelligence could change the work that people actually do in different occupations. It uses three stages of AI capability, one after the other:
- Cognitive intelligence: AI's ability to understand, analyze, and create information.
- Digital agency: AI's ability to run software on its own and carry out complex digital workflows.
- Physical agency: AI's ability to act in the physical world with more and more human-like speed, dexterity, and adaptability.
They're cumulative: the second stage builds on the first, and the third on both.
The aim here is not to predict unemployment, to argue whether humans will still be needed, or to guess exactly when each stage will arrive. Instead, it looks at how work itself might change, and where productivity gains might come from. To do this, we'll look at 100 occupational groups.
They cover agriculture, healthcare, education, business, manufacturing, transportation, construction, services, and other major areas of economic activity.
These are reasoned capability scenarios, based on the tasks of each occupation. They are not based on 100 controlled experiments.
1. Who Works, and Where
Before we talk about the impact of AI, we need a clear picture of the world's occupations.
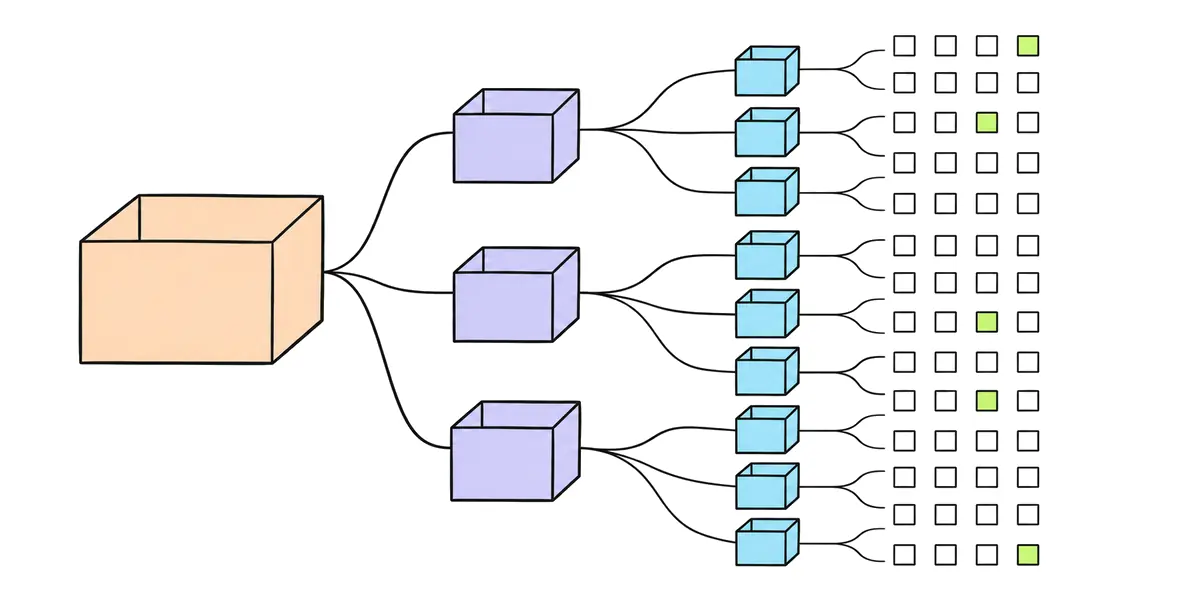
A good international starting point is the International Labour Organization's International Standard Classification of Occupations, also called ISCO-08. ISCO-08 groups the world's occupations into:
| Classification level | Number of groups |
|---|---|
| Major occupational groups | 10 |
| Sub-major groups | 43 |
| Minor occupational groups | 130 |
| Detailed unit groups | 436 |
Source: International Labour Organization, ISCO-08. The big advantage of this classification is that it's built for comparing countries. Not for describing employment in just one country.
There is one statistical problem, though.
There's no easy-to-find, complete, globally standardized public list of the 100 biggest individual occupations by employment.
The ILO publishes estimates of global employment and how it splits across occupations. But the global numbers are usually more aggregated than the specific occupations we'd need for an accurate top-100 list. Detailed national employment surveys exist.
But combining them properly takes careful adjustments for country coverage, classification differences, missing data, informal work, and survey years. So this article doesn't pretend that its 100 occupations are exactly the world's 100 biggest by headcount. Instead, it picks 100 well-established ISCO-08 minor occupational groups.
The choice favors work that many people do, and covers the whole global economy. The numbers only identify the entries in this analysis.
They're not a worldwide ranking by employment.
The 0 minor groups of this post
This matters. Calling a speculative list an official statistic would undermine the whole point of a data-driven analysis.
The whole world looks different
Most of the world's workers are not office workers. World Bank data, based on ILO estimates, shows that around 25.8% of global employment was in agriculture in 2025. The ILO also estimated that 57.9% of global employment was informal in 2025.
Sources: World Bank — Employment by sector and ILO — The World of Work and the 2030 Agenda.
In agriculture: 25.8%
Informal: 57.9%
These numbers matter a lot for AI. An AI software agent that can work with spreadsheets might change a company's finance department completely. But it might do very little for a subsistence farmer who has no reliable electricity, internet, or affordable machinery.
Even within the same occupation, the impact of technology can vary a lot between countries. A commercial farmer using GPS-equipped machinery starts from a very different place than someone farming a small plot by hand. So if we only look at AI from a digital point of view, we miss a large part of the work humanity does.
2. One Hundred Occupations Across the Three Stages
I went through 100 occupational groups, from managers and doctors to cooks, farmers and refuse workers, and asked the same questions of each: what the work is today, and what each of the three stages adds. Work done mostly with information and software gains the most from Stages 1 and 2. Work done mostly with the hands gains little until Stage 3. Section 3 draws out the patterns.
The full list is long, so it sits in the appendix at the end, as one table you can search, sort and open row by row.
3. What the 100 Occupations Reveal
Looking at all these occupations together, a few patterns keep coming back. The most important one: how useful AI is economically depends on how intelligence connects to the actions needed to produce something valuable. Each occupation has different bottlenecks.
For some, the bottleneck is understanding information. For others, it's working through software. For others, it's handling physical objects.
And for many, it's a mix of all three.
Pattern 1: Some Jobs Gain Most From AI That Works a Computer
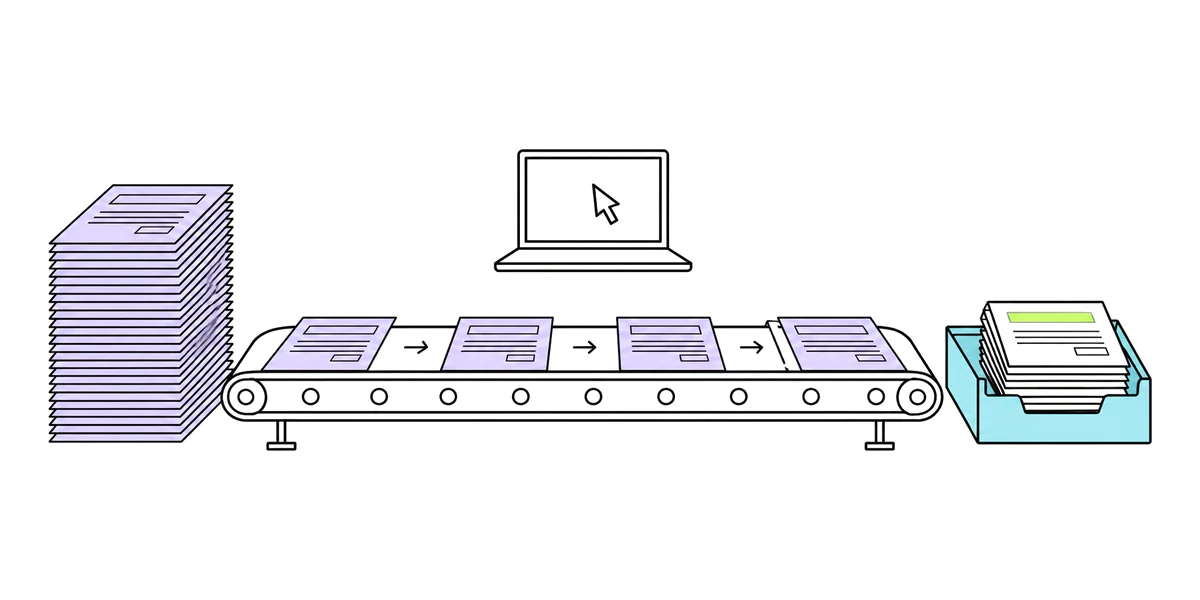
Take accountants, clerks, administrative specialists, IT support technicians, and many finance professionals. These occupations rely heavily on digital systems. Stage 1 can speed up reasoning, documentation, and preparing information.
But Stage 2 changes something deeper: the AI can carry out the workflows that people used to do by hand. That's a big difference. An AI that explains how to reconcile two accounting data sets is useful.
An AI that fetches both data sets, compares them, looks into the discrepancies, updates the accounting system, and writes an exception report is far more useful. For these occupations, going from assistance to reliable agents may change workflows more than better language generation alone. Stage 3 may add fairly little.
That doesn't mean every digital workflow can run on its own. Data quality, access permissions, handling of exceptions, and institutional accountability still decide what can be handed over.
Pattern 2: Physical Jobs Are Held Back by Something Else
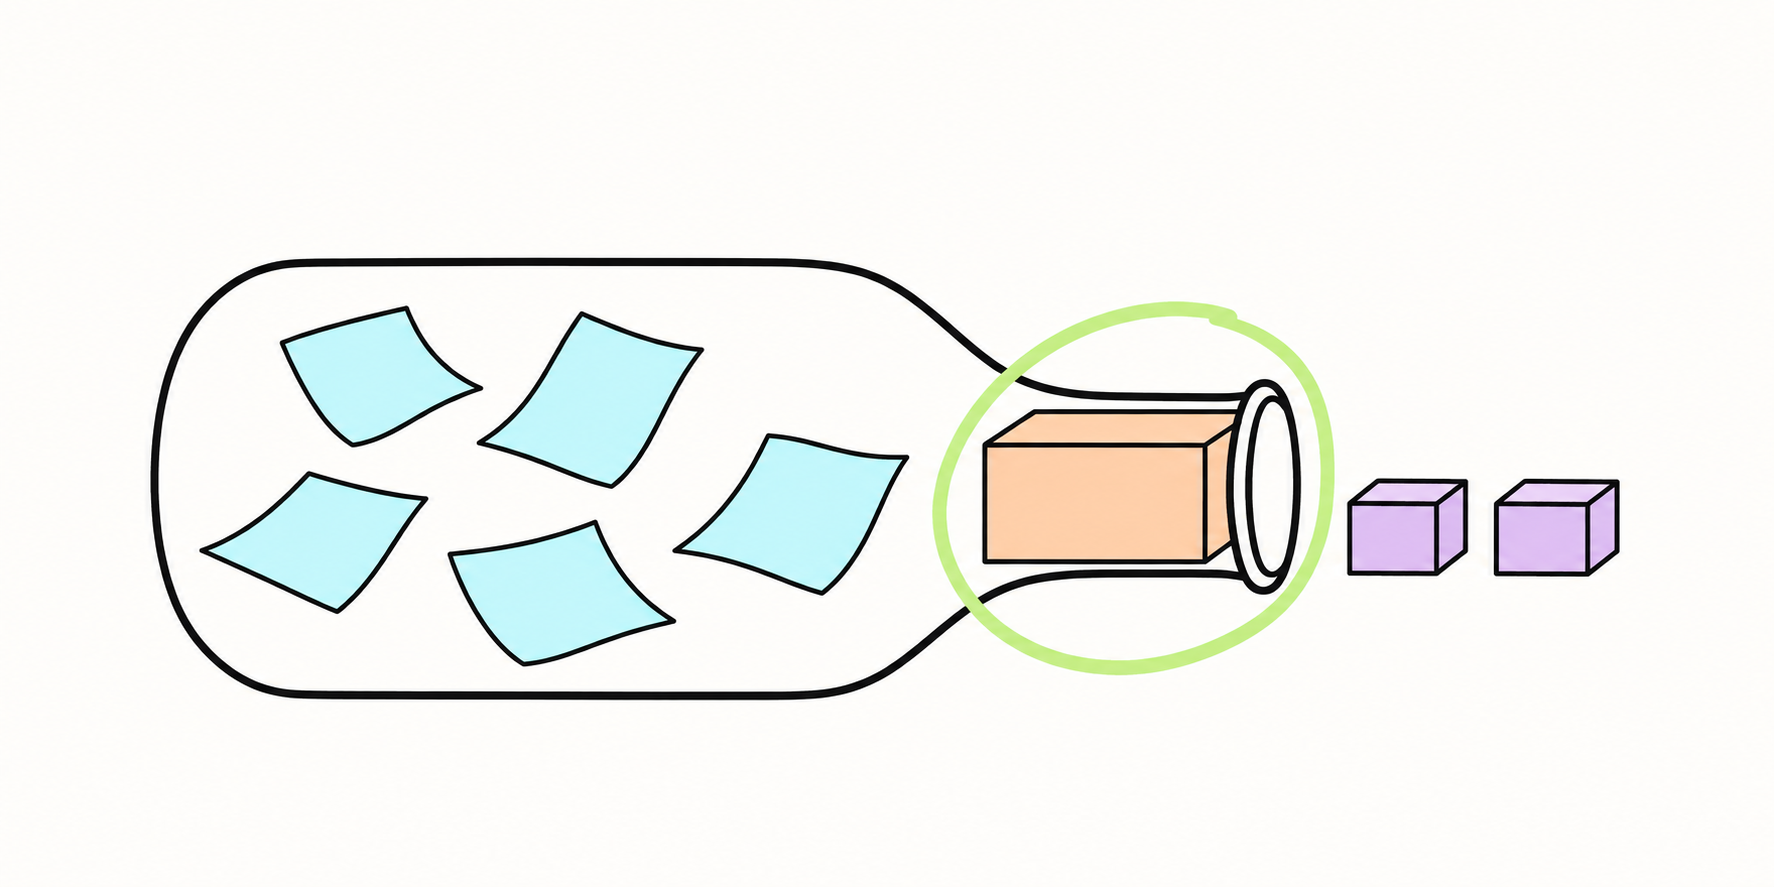
Take farm laborers, construction workers, cleaners, assemblers, and warehouse workers. Stage 1 can give better instructions, scheduling, and information. Stage 2 can improve coordination.
But neither one necessarily does the main physical work. A cleaner with access to a great language model still has to clean the room. A farm worker with a smart digital assistant may still have to harvest the crops.
Stage 3 changes this, because now AI can do suitable physical tasks. But the cost of the robot, its maintenance, safety, and adaptability may matter more than how intelligent it is. A robot that can do a task but costs more than the value it produces doesn't raise productivity.
This matters most in countries where labor is cheap and capital is scarce.
Pattern 3: Some Jobs Gain at More Than One Stage
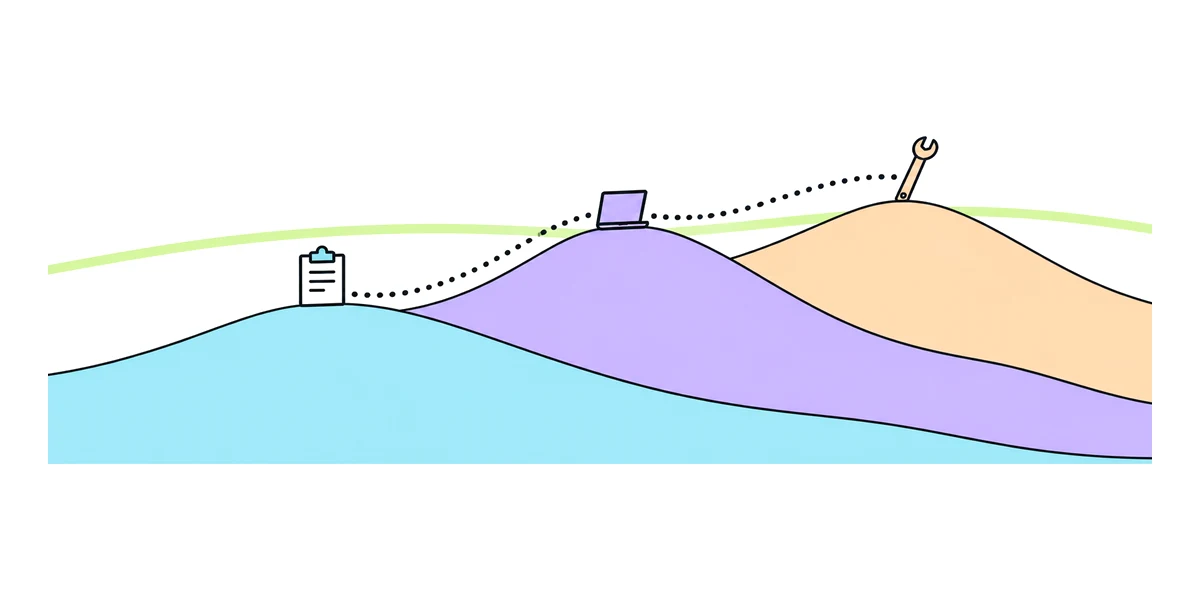
Healthcare is a good example. A doctor's work mixes information processing, digital coordination, physical examination, and dealing with people. Stage 1 can cut some of the documentation and information lookup.
Stage 2 can cut administrative friction between hospitals, labs, and health records. Stage 3 can help with physical procedures and clinical logistics. Each stage helps a different part of the job.
So the gains from later stages may add to the earlier ones, rather than replace them. The same goes for engineering, industrial maintenance, agriculture, and some service occupations.
Pattern 4: Having AI Can Matter as Much as What It Can Do
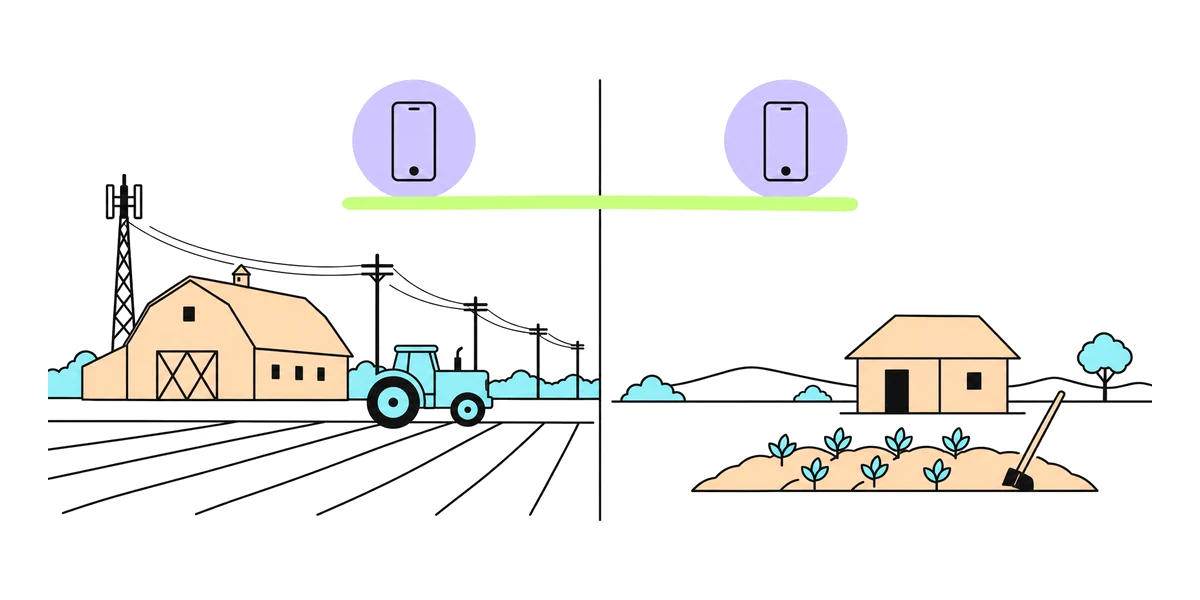
Access to digital infrastructure is very unequal across the world's workforce. A wealthy hospital may run AI systems connected to electronic health records. A rural healthcare provider may work without reliable internet or digital records.
A large farm may connect AI to industrial farm machinery. A small farmer may only have a smartphone. The AI model could be exactly the same, but the economic results could be completely different.
The ILO's 2026 Employment and Social Trends report points to lasting differences between countries in productivity, infrastructure, informality, and economic opportunity. So what is technically possible and what people actually adopt should not be treated as the same thing.
Pattern 5: More Productive Does Not Always Mean Faster
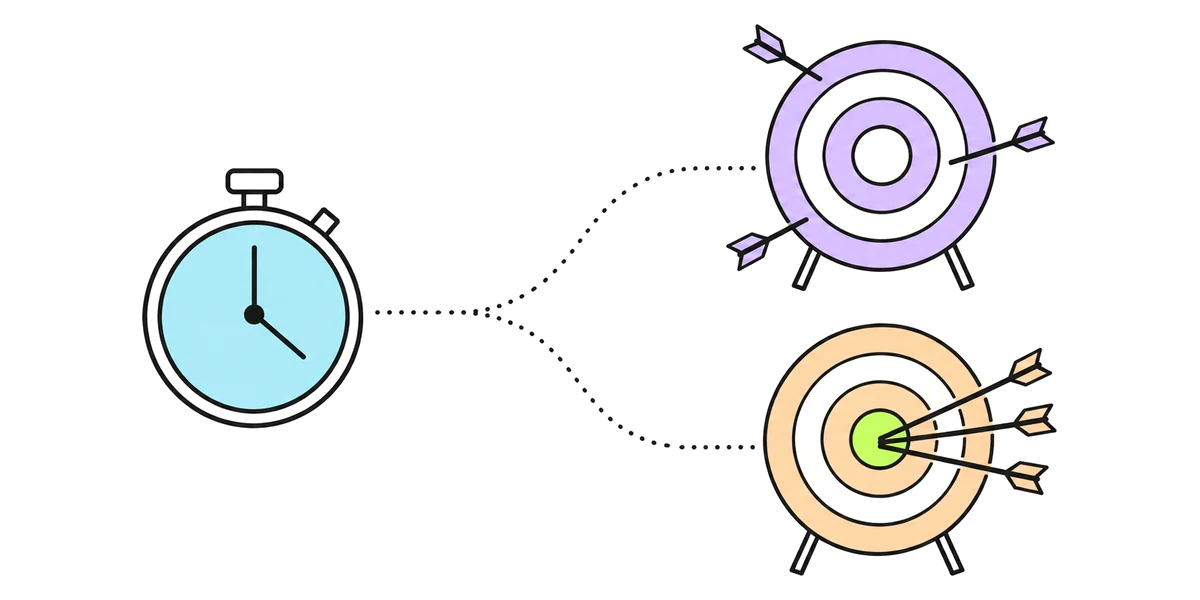
Sometimes AI improves the quality of work instead of the quantity. An engineer might run more simulations before approving a design. A doctor might look at more relevant clinical evidence.
A teacher might give more personal feedback. A farmer might spot a crop problem earlier. In each case, the professional may work about the same amount of time, but get a better result.
On the other hand, an AI can seem helpful while it actually slows work down, with needless suggestions, mistakes, or extra reviews. So the productivity measure has to match the real goal of the occupation.
4. How to Measure What AI Adds
The 100 occupational scenarios help us see what could change. But real quantitative forecasts would need one more layer of research. For each occupation, we would need to estimate:
- The share of working time spent on each task.
- The part of that task that AI can do or speed up.
- How much human review and correction is needed.
- What it costs to deploy the technology.
- The effect on the final output and its quality.
- Whether the saved time can go into more productive work.
A simple starting point would be:
Net time saved = baseline task time − AI-assisted task time − extra review and coordination time.
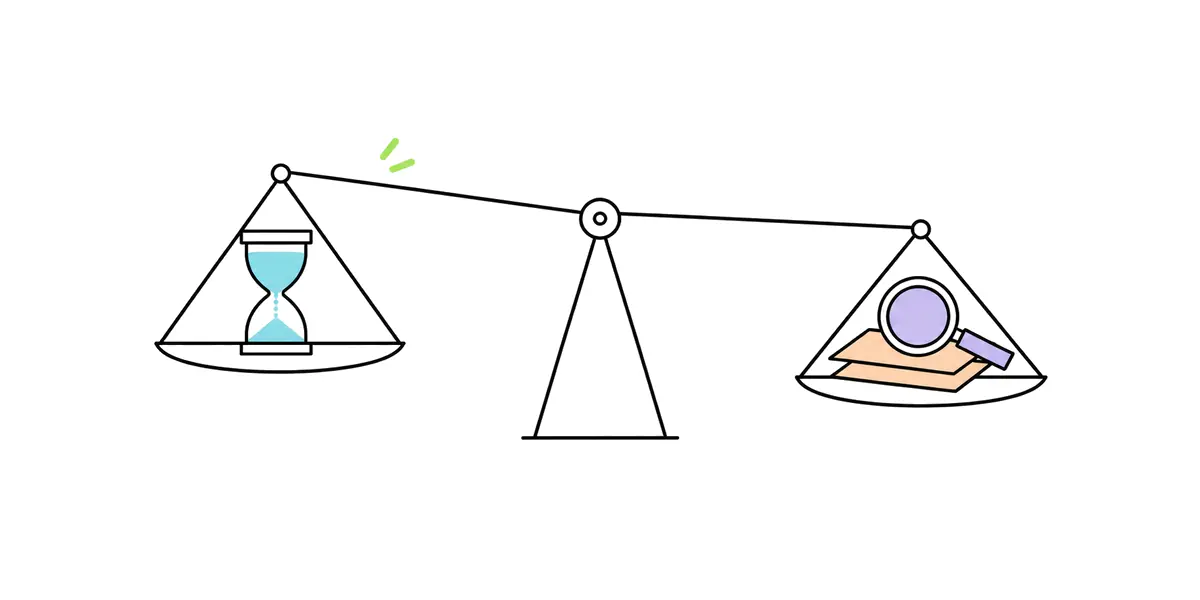
For an occupation with several tasks, we could add up the time saved on each of them. But this would still measure time saved, not automatically total productivity. To estimate gains in output, the model would also need to include physical limits, demand, quality requirements, and new bottlenecks.
A farmer who saves 2 hours of planning may not be able to grow more crops if land or water is the main limit. A doctor who saves 2 hours of documentation may not be able to see more patients if exam rooms or open appointment slots are the bottleneck. An office worker might win back several hours of administrative time, but have no more meaningful work left to do.
That's why this article doesn't give each occupation a precise-looking productivity multiplier, like 1.6× in Stage 1 or 4.2× in Stage 3. That would suggest evidence that doesn't exist yet. A more rigorous quantitative follow-up would use real data on how each occupation's time splits across tasks, controlled studies, conditions in each country, and explicit uncertainty ranges.
The ILO's 2025 research is already a useful starting point. Its refined global index of generative AI exposure combined task-level evidence, expert assessments, and model predictions to estimate exposure across occupations. It concluded that about one in four workers worldwide were in occupations with some exposure to generative AI, while only 3.3% of global employment fell into its highest exposure category.
Some exposure to generative AI: 25%Highest exposure category: 3.3%
These numbers measure how exposed occupations are to generative AI, not productivity gains anyone has observed. And they don't estimate the effects of mature computer agents or general-purpose physical robots. That difference really matters.
5. Intelligence Is Only Part of Getting Work Done
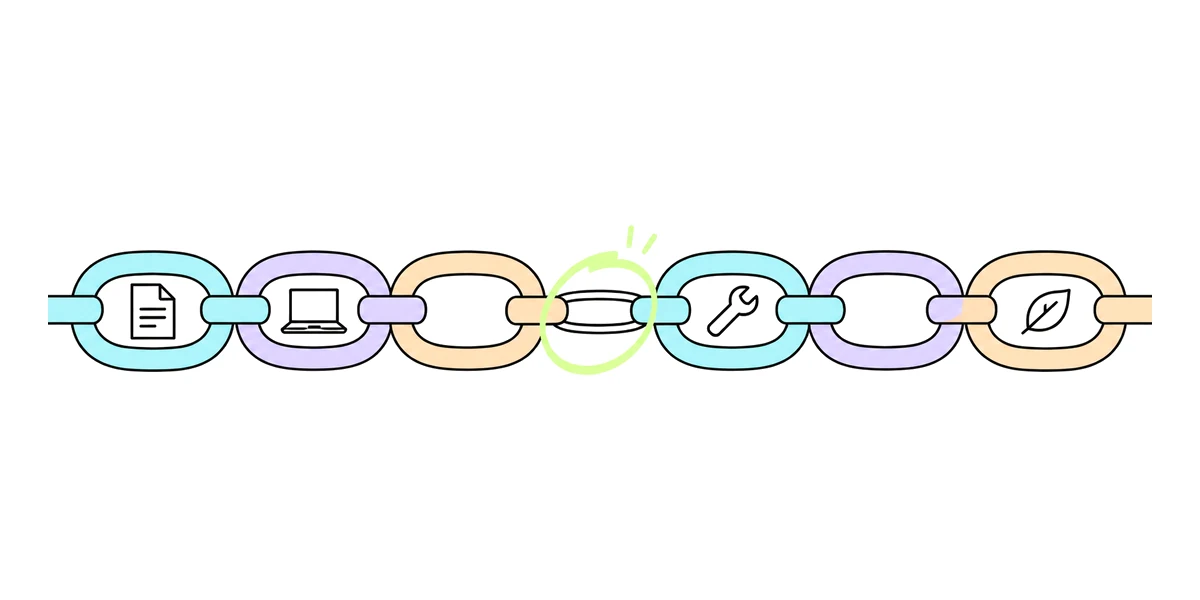
Going from Stage 1 to Stage 3 shows something interesting. Human work isn't valuable just because people can think. Work creates value by transforming information, coordinating activities, changing the physical world, serving people, and producing useful results.
Intelligence plays a part in almost all of these, but it's not the only limit. For an accountant, the biggest opportunities may be information processing and software workflows. For a truck driver, driving the vehicle may be most of the job.
For a farmer, physical work and biological conditions matter. For a teacher, better information processing may help, but the real goal is still learning and the students' development. For an electrician, knowing how to repair a circuit and physically repairing it are two different abilities.
So there's no single AI productivity curve that fits everyone. Instead, each occupation has its own chain of limits. Some may see the biggest change to their workflow in Stage 1.
Others may benefit most once AI can run software. Others may see fairly small changes until physical systems get muchmore capable. And some may benefit from all three stages in different ways.
So the core question for any profession is:
What is stopping this worker from producing more valuable output right now, and which AI capability actually removes that limit?
That's a much more precise question than asking how smart a model has become.
Sources
Occupational classifications and global employment
- International Labour Organization — ISCO-08. The official worldwide classification of occupations, with group definitions and task descriptions.
- International Labour Organization — ILOSTAT. International employment statistics and occupational data.
- International Labour Organization — Employment and Social Trends 2026. Global employment, productivity, and labor market conditions.
- World Bank — Employment by Sector. Global employment split across agriculture, industry, and services.
- O*NET Database. Detailed occupational activities, tasks, and work characteristics. It mostly reflects the United States, so it's used here only as an extra task reference, not as a source of worldwide employment rankings.
AI and occupations
- ILO — Generative AI and Jobs: A Refined Global Index of Occupational Exposure (2025). A detailed assessment of AI exposure across occupational tasks.
- ILO — Generative AI and Jobs: A Global Analysis of Potential Effects (2023). Earlier research on occupational exposure and on AI that adds to tasks rather than taking them over.
Methodological disclosure: The source publications provide employment classifications, measured workforce statistics, task descriptions, and exposure estimates. The choice of 100 occupational groups and the future workflow scenarios are my own synthesis. They are not official ILO forecasts, and no occupation-level productivity percentage that nobody measured is presented as a fact.
Appendix
For each occupation:
- Today describes the main work.
- S1 describes what cognitive AI changes.
- S2 describes what reliable digital agents add.
- S3 describes what advanced physical agency adds.
- Productivity names where the gain is most likely to come from.
ISCO codes identify the matching international occupational groups. One group sometimes covers several common job titles.
No occupation matches the search.
The stages themselves, and why they are stages and not dates, are in the previous post: The three stages of AI progress.